Wednesday, August 24th, the S&P 500 declined over -2% for the first time since 400 days
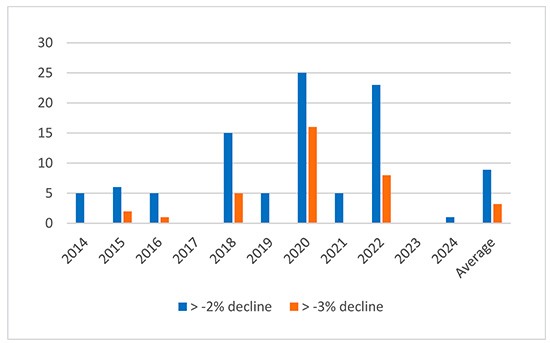
That Wednesday something happened that had eluded the market for exactly 400 trading days. The S&P 500 sold off more than -2%, something which had last happened on 15 December 2022. This 400-session absence of a downside movement in excess of -2% was the longest such streak since the 2008 Great Financial Crisis. Frequent participants of our True Partner Fund quarterly webinars may recall that in our view the absence of larger downside movement days has been somewhat of an oddity. As the chart below shows, over the prior ten calendar years on average 8.9 declines in excess of -2% occurred on an annual basis, as well as 3.2 declines in excess of -3%. Outside of the recent period, 2017 is visible as another episode of remarkable quiet, when a draught of 351 trading days gave way to the market decline on 2 February 20218 which triggered the ‘Volmageddon’ in which the XIV, a short-VIX futures ETF, imploded.
In our volatility updates, we have referenced the advent of daily (or 0DTE) options as a contributing factor to the suppressed volatility. The large popularity of daily options has ushered in a suite of quantitative investment strategies (‘QIS’) tied to daily options, including those in which investment banks offer exposure to trading strategies which sell 0DTE on a daily basis. Selling ultra-short options generates exposure to daily movement in its purest form - at the end of the trading day the options expire and settle against the closing price. A simple variety would be selling the then at-the-money straddle at the opening of the market. At the end of the day, a profit is made if the value received in selling the straddle exceeds the difference between the strike price and the settlement value at the end of the day (i.e., the distance the market ultimately traveled from that strike price).
The lack of significant movement has been a boon for this strategy and as profitability tends to attract investor attention, the size of QIS selling daily options has ballooned. The options which these strategies sell end up as long positions in the dealers’ books (predominantly market makers). As dealers do not intend to have an opinion on market direction, they neutralize the market directional exposure through delta hedging2. Due to the ‘gamma’, stemming from the favorable asymmetry of the pay-off of an options contract3, delta hedging long option positions would allow the dealer to purchase the underlying instrument in the event the underlying instrument declines and to sell the underlying instrument in the event the underlying instrument rises. Therefore, when QIS and other market participants have sold large quantities of daily index options and as a result the dealers hold large quantities of daily index options, should the index decline the dealers will typically purchase futures dampening the decline. And equivalently, when the index rises the dealers will typically sell futures, dampening the increase.
But as seen last Wednesday, at times the market does move. Let’s run through a numerical example of how the simple strategy of selling daily options on the S&P 500 at the open would have worked last Wednesday. Right after the opening, with the spot index trading at just below 5505 points, the daily 5505 straddle traded at 26.50 points4. But at the end of the day, the S&P 500 closed meaningfully below that level, at 5427.13 points which resulted in a settlement value of 77.87 points for the 5500 put. The strategy would therefore generate a loss of 51.37 points. In USD terms with a contract size of 100, each contract sold would have yielded a loss of USD 5,137 which is a vast multiple of the expected profit of selling a daily straddle. The USD 2,650 in premium for one contract would be the theoretical maximum profit if the index would close at exactly 5505 points but in reality the index always exhibits some noise, even on quiet days. For the 20 trading days preceding last Wednesday, the average difference between the opening price and the closing price for the S&P 500 was 24.10 points. A repeat of that average movement on Wednesday would have yielded a profit of only 2.40 points (or USD 240 per contract).
After a strongly negative day, curtailment of the strategy in the next session would make sense. This is especially in light of the fact that market movement such as last Wednesday does not happen in a vacuum. The reason markets had a difficult session and the sources of uncertainty may well linger over subsequent trading days. Historically, volatility tends to cluster, a dynamic in which days of higher volatility usher in further volatility going forward (i.e. volatility begets volatility). Regardless of the exact reasoning, should the overall selling of daily options be curtailed this could result in smaller long positions in these daily options by the dealers. This in turn would see less impact of their delta hedging, allowing the markets to roam more freely.
Markets appeared freer to roam on Thursday
On the following trading day, this is exactly what we saw. As discussed above, the impact of prolific delta hedging by dealers would be to ‘smother’ market movement. While ultimately the overall supply and demand for shares drive the market direction, the speed at which the market moves may well be impacted. And in the absence of prolific delta hedging, the market may exhibit more intra-day swings as well. One measure to observe intra-day market movement would be the ‘distance traveled’. When for example one would cut the trading day in 20-minute segments and tally up the absolute movement which occurred between all the segments, one could get an indication of the intra-day movement for the trading day. And the speed of movement would be represented by the magnitude of movement during each of the individual 20-minute segments.
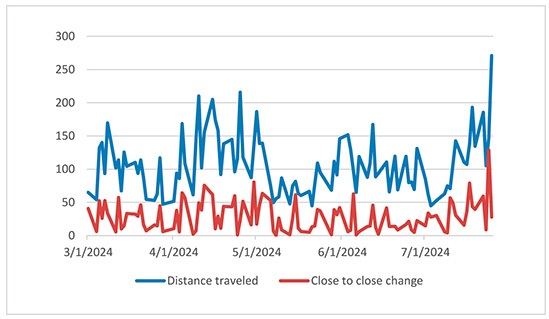
In terms of the distance traveled, Thursday was a far more volatile day than Wednesday. Actually, it was the most volatile day of 2024 applying this metric. Despite a relatively muted change from close-to-close (the S&P 500 was down -0.51% on Thursday compared to a decline of -2.32% on Wednesday) the index had sharp intra-day swings. As a result, the movement on Thursday of 270.97 points was nearly double the 147.83 points movement on Wednesday.
The below graph shows both the distance traveled and the absolute close-to-close change for the S&P 500 between 1 March 2024 and 25 July 2024. Next to the peak value of Thursday 25 July, it is also visible that while the absolute close-to-close movement for the month of April was not that dissimilar from surrounding months, the distance traveled was higher. It is not a coincidence that for True Partner Fund April 2024 was the most positive month for the year so far as that month provided more volatility opportunities.
When comparing Thursday to Wednesday a second aspect to consider is the speed at which movement occurred. On Wednesday, the market more or less continually, but gradually, slid over the trading day, with declines in most of the 20-minute segments. The price changes during each of these 20-minute segments would indicate the speed of movement. After the open on Wednesday, this movement was relatively muted compared to movement logged on Thursday. The median absolute movement of the 20-minute segments was 4.1 points on Wednesday and 11.9 points on Thursday, nearly three times as large.
Thus, further to the analysis of distance traveled, it appears the market was indeed freer to roam in the direct aftermath of a loss-incurring day for strategies selling daily options volatility. The S&P 500 had both a higher degree of absolute movement and faster movement as well. It thus appears that the gamma held by the dealers on Thursday had decreased compared to Wednesday, which is likely reflective of curtailment of volatility selling strategies. What up until Wednesday had a been a daily drumbeat of replenishing options sold into the market, had slowed down to a trickle. And with less gamma ending up at the dealers, their delta hedging had less impact of throttling market movement. However, looking at the characteristics of options, there is also a second reason why the dealers could end up with less ammunition to delta hedge and that would be an even larger intra-day move.
All optionality is local
Dealer delta-hedging is driven by the fact that the sensitivity of options to changes in the share price (the ‘delta’) changes when the share price moves. The gamma is thus the second derivative of the option value to the underlying share price. But the gamma itself is also not constant. It logically is highest around its strike price and tapers off in both directions. The gamma of an option thus has a bell-shaped curve, as per the graphs below.
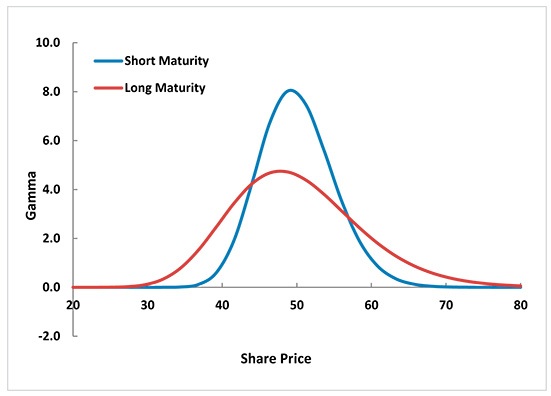
The graphs show the gamma profile of two options with a strike price of 50. Next to the peak of the bell-shaped curve around the strike price, the difference between gamma of a shorter-dated option and a longer-dated option is relevant. The shorter the time to expiry, the more the gamma is concentrated around the strike price. Thus ultra-short options such as 0DTE have very high gamma around the strike price, but that gamma should taper off very quickly. Compared to the ‘short maturity’ in the graph, a daily option can ‘run out of gamma’ following a movement of only a few percent.
Therefore, if a movement like Wednesday’s would continue over the trading day to reach an even greater level of decline (and a lower level in the underlying index), the suppressing impact of delta-hedging by the dealers would also diminish, or even vanish. And as per the earlier graph, a downward movement in excess of -3% could historically still be expected to occur several times per year. If Thursday’s market action is indicative of a market with a lower degree of delta hedging by dealers, that same increase in magnitude and speed of movement may well cause an acceleration on an already down day. Especially as in the face of increasing losses sellers of volatility may well opt to unwind their exposure and repurchase their now far in-the-money short put options. Such a capitulation moment would trigger additional sales of the underlying index (as the dealers who sold these put options would delta hedge, selling the futures).
Breaking a fragile equilibrium
The suppressed movement in equity indices has had other second-order effects as well, of which a notable (and well-covered) one is the strategy of ‘volatility targeted investing’. In a nutshell, in this strategy the size of equity exposure is tied to the level of volatility which the underlying equity exhibits. Usually a short-term measure of realized volatility is applied. In order to keep expected risk at the target level, the exposure would be increased in periods of low volatility and decreased should volatility rise. One of the tenets of this strategy is the clustering of volatility discussed earlier. When volatility begets volatility (and market volatility generally ties to downward movement), reducing the equity exposure when volatility rises would lower investment risk in the subsequent volatility. One large movement (let alone more consecutive ones) could quickly and sharply change the short-term realized volatility measure used to define the volatility target and thus trigger a strong reduction in the volatility targeted equity position.
But in an echo of the concept of portfolio insurance in the late 1980’s, this approach could create a vicious cycle in which the selling of equities in order to reduce the position to the volatility target would generate volatility by itself, further reducing the targeted equity position and thus inducing more selling. And adding to the fragile equilibrium is the continued popularity of leveraged ETF’s which by nature also would have to sell their underlying instrument in the face of market declines. Notable examples would be the USD 21 billion ProShares UltraPro QQQ (ticker: TQQQ) which seeks investment returns of three times the daily performance of the Nasdaq 100 as well as other popular leveraged offerings on high-flying technology names such as Nvidia.
All in all, we remain of the opinion that the current historically low levels of volatility could reprice meaningfully higher. In light of the various macro-economic and geopolitical risks hiding in plain sight, market structural factors as we describe in this flash-update could provide the proverbial spark to the powder keg.
–––––––––––––––––––––––––––––––
The publication of this article is available as a PDF. Download it following the link below:
Volatility Snap Update 30 July 2024>>
–––––––––––––––––––––––––––––––
1. Source: Bloomberg data, True Partner Capital
2. Simply said, if one holds a call option, this position increases in value when the underlying instrument rises and decreases in value when the underlying instrument declines. An offsetting transaction would be to sell units of the underlying as that position generates an opposite exposure. As such, the combined position is initially delta neutral.
3. Referred to as gamma: when the underlying price rises, the value of the call increases faster whereas the value of the put decreases slower. But when the underlying price declines, the call value decreases slower and the put value increases faster. In other words, compared to a delta hedge movement is favorable for the holder of the option.
4. At 08:30:03, the first traded prices were USD 13.50 in the call and USD 13.00 in the put.
5. Source: Bloomberg data, True Partner Capital
6. Source: Tobias Hekster, Govert Heijboer – Derivatives trading course; Chinese University of Hong Kong
- Bloomberg article highlights True Partner’s strong performance in April and year-to-date
- Bloomberg Publication: True Partner Volatility Hedge Fund Gains 5.9% During April Rout
- True Partner to join the London Volatility Investing Event 2025
- Wat zijn de gevolgen voor pensioenfondsen van een zware beursdaling?
- What would a significant market downturn mean for Dutch pension funds?
- True Partner article: Does America First signal the end of American exceptionalism?
- True Partner’s co-CIO speaking at the Global Volatility Summit Tokyo
- True Partner Capital speaks in Northern Trust panel about Navigating the Shift to WTP
- Happy New Year
- True Partner article: 2025 Market Outlook
- More news articles >
- Go to events >