Page 1: Volatility update March 2019

03-2019 – By Mr. Tobias Hekster and Mr. Govert Heijboer, Chicago / Hong Kong
With equity markets roaring up in the start of 2019, one can be forgiven to have forgotten that a mere ten weeks ago the bears were firmly in control with plenty of shell-shocked investors liquidating their market exposure. Maybe this explains the severity of the rebound, with money on the sidelines rushing back in once a further sell-off into a real bear market was averted. If the fourth quarter of 2018 were a brief mental exercise in what markets would look like when off the monetary life-support, the doctors at the Fed and other central banks have quickly decided the patient is not yet ready.
An old Dutch proverb goes “gentle healers make stinking wounds’”, which loosely translates as, it is better to treat a problem thoroughly even if the treatment is painful, otherwise it may get worse. The markets immediately took the flexibility expressed by Powell on not only future rate hikes but also on the Fed balance sheet run-off, as an invitation for an extended bull party. The monetary punchbowl was back in the middle of it, just like in 2017. As if 2018 never happened. Permit us to suggest it would be wise to reflect on last year taking into account the Dutch proverb.
While we appreciate a good party as much as the next person, we wonder whether the perceived similarities with 2017 ring true. We dare say that despite the rosy mood and cratering volatilities globally, we are not entering a sustained period of depressed volatilities. Market complacency has gone too far, too fast.
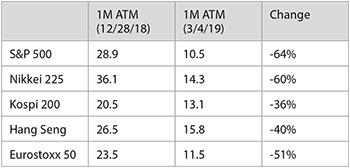
Implied volatilities have come down radically over the past 10 weeks. Table 1 below compares the 1-month at-the-money implied volatility on December 28th 2018 for several global indices with their current levels. Although part of the decline is driven by higher index levels (in general, options with higher strike prices command a lower implied volatility), significant supply of volatility has hammered down options prices.
Table 1: Changes in Implied Volatility

However, implied volatility is only one side of the equation. Where implied volatility can be seen as the cost of potential movement (in the form of daily time decay), the revenue of options depends on the actual movement the markets exhibit. From the actual movement perspective, the following statistic is telling. During all of 2017, there were a total of seven trading days in the S&P 500 with a >1% move, while in January 2019 alone we have already experienced seven of these trading days.
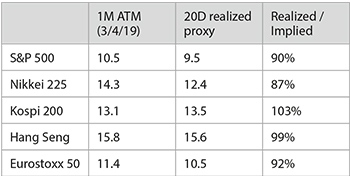
The observation whether volatility is ‘cheap’ or not depends on the degree of actual daily movement. When comparing the current levels of implied volatility with our generic (proprietary) measure for actual movement, most indices trade around fair value, as depicted in Table 2 below.
Table 2: Current Implied and Realized Volatility

In other words, volatilities in key indices such as Nikkei, S&P 500 and Eurostoxx 50, have compressed to such an extent that they are actually trading at their current realized levels. Anecdotal evidence says the volatility-short trade is alive and kicking. A valid question is how much room there is to run from here. When implied and realized volatility have converged at these low volatility levels, the benefit from a volatility short position (assuming the trader hedges his or her risk dynamically) would only lie in further volatility compression. Selling options is only a carry trade as long as the daily receipt of time decay exceeds the actual daily movement. As both movement and implied volatility have come down radically since the end of December, it is not a surprise that the CBOE Eurekahedge Short Volatility Index was able to recapture a sizeable chunk of December’s losses in January. (and it is our expectation they ought have recovered more in February).
Continue reading to the next page of this article >>
–––––––––––––––––––––––––––––––
The full publication of this article is available as a PDF. Download it following the link below:
March 2019 Volatility - Party like it's 2017>>
- AI Top or Slop: When Markets Reach Peak Magnificence
- The Hedge Fund Journal features True Partner's award-winning volatility strategies
- True Partner Fund wins award for strong performance
- True Partner releases new thought piece focused on Dutch pension funds
- True Partner Fund nominated for best performing relative value fund
- Bloomberg article highlights True Partner’s strong performance in April and year-to-date
- Bloomberg Publication: True Partner Volatility Hedge Fund Gains 5.9% During April Rout
- True Partner to join the London Volatility Investing Event 2025
- Wat zijn de gevolgen voor pensioenfondsen van een zware beursdaling?
- What would a significant market downturn mean for Dutch pension funds?
- More news articles >
- Go to events >