
What just happened?
On Monday August 5th, Asian equity markets suffered steep losses, and in the US, the VIX index spiked to a high of 65 in pre-market trading and then quickly reverted lower after the US market open. While the behavior of the VIX was generally perceived to be a bullish sign, we would be more cautious. Trading flows suggest only a relatively limited number of investors cut short volatility positions, with most waiting out the short-lived storm. The latter group ended up unscathed, but we wonder whether they will be as fortunate next time around. In this article, we provide some insights into the VIX calculation, the market circumstances that Monday, and some takeaways for how potentially to profit from a future stress event.
Brief recap of August 5th
A lot has been written about the VIX spike early August. But as we flagged in our update earlier in August, there was quite a bit more to it than meets the eye. As a quick recap, we think the overnight VIX prints said more about the technicalities of the VIX methodology than about market risks. The calculation of the VIX index is based on an extensive range of option contracts in the S&P 500 with different maturities as well as a wide range of strike prices, including the less liquid out-of-the-money contracts. The market prices of all these options are tallied into the VIX number in a process where the lower strikes (i.e. the downside puts) have a relatively heavier weight.
On Monday August 5th, prior to the market open, some traders who were caught wrongfooted over the weekend rushed to unwind short positions, purchasing downside skew, which pushed up prices for some of the options that form components of the VIX calculation. But the VIX also uses prices for far out-of-the-money options, which tend to be more thinly traded (particularly outside cash market hours) and algorithmically quoted by the market makers. When the algorithmic market makers are reluctant to take on positions, they tend to widen their bid/offer spreads to provide a bigger margin of safety. This raised mid prices and had a disproportionate impact on the VIX level. But while this occurred, traded volumes and market liquidity in the downside instruments were very limited.
VIX futures, on the other hand, were continually traded and while these also traded at elevated levels, they did so to a much lesser extent. As a result, VIX futures meaningfully lagged the spot. And once the US stock markets opened at 9.30am (EST), the spike in the VIX spot quickly receded, while the VIX futures saw declines of a smaller magnitude, as is visible in the below chart.
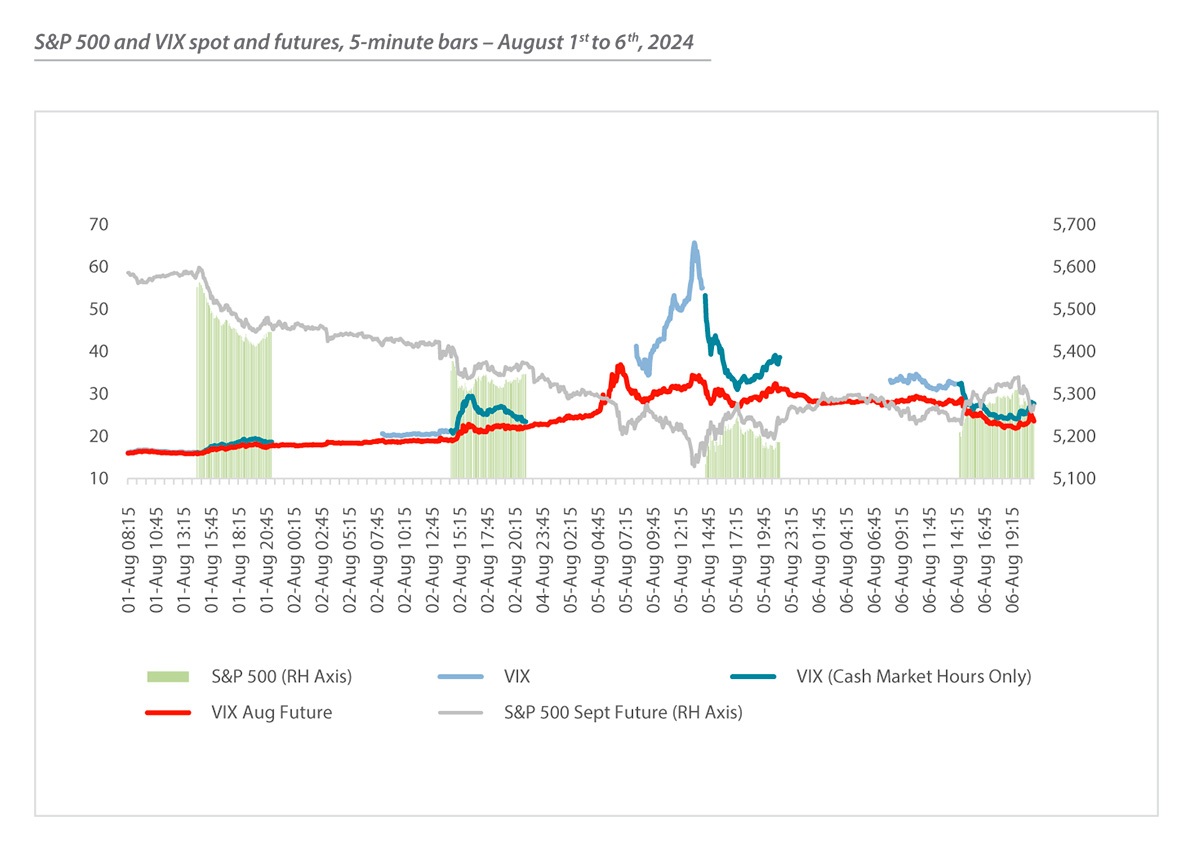
This whole episode does not mean the pre-market VIX print was inaccurate (the methodology was followed), but it does make it less representative of traded volatility levels. Indeed, should an investor try to mimic that elevated VIX level by trading S&P 500 options directly, he/she would find it was not really a tradable level. For those familiar with the nuts and bolts of the VIX, two alternative versions for the VIX calculations were also disseminated using the bid or the offer prices respectively instead of the much more widely followed mid-market price. At the time of the peak in the VIX spot, the differential between the VIX calculated using the bid prices and one calculated using the offer prices was a whopping 20 points (for reference, the 10-year average daily closing gap between the bid and ask prices is just under 0.5 volatility points and the YTD average prior to 5th August was 0.35 volatility points).
What to make out of the VIX price action?
Over the subsequent days, both the VIX spot and the VIX futures reverted back down, giving up all their gains in August. This ties to a market theme in which the spike in the VIX and the subsequent (nearly immediate) reversal have been characterized as a bullish signal for equity markets. The theory behind this viewpoint is that when market participants are most anxious and pessimistic, markets tend to be oversold while at the same time the peak anxiety represents itself in high volatility levels. This is where the VIX’s moniker of fear gauge finds its origin. In this logic, markets then reached a ‘cathartic release’ in a VIX spike, paving the way for a strong recovery once the VIX retreats from its highs. This contrarian behavior is also reflected in the Dutch saying that “the prettiest flowers grow at the very edge of the cliff”. Once the panic has passed and investors pile back into the markets, all seems to be forgotten.
However, for this thesis to hold true, the spike in the VIX ought to be associated with an actual peak in market anxiety. It is much less obvious that there was such a peak. To provide some context, the movement in US equity futures was larger than we’ve seen lately, but as we had also argued in our recent volatility snap update, a down move of some 3% is not that uncommon when looking further back than the quiet past 18 months. Nor would a peak-to-trough decline from the all-time high of not even 10% be normally described as a market panic. As we noted in our previous piece, this time around the VIX spike occurred for market structural and technical reasons much more than that it represented a true investor panic. Thus, from observing the actual market movement and from a market-structural perspective, we believe investors should also be cautious in interpreting the reversal of the VIX as an all-clear to reload on risk.
However, instead of arguing about exactly what kind of VIX reversal is needed for a bullish signal, we would like to take the discussion a step further by seeing what lessons may be learned from digging into the market action around the VIX. We may well have witnessed a close call, with markets narrowly avoiding a much scarier outcome. The fact that the severity of the movement in VIX that Monday morning was the result of the market structure points to what we believe to be a potentially more serious issue - temporarily impaired market liquidity in the biggest equity derivatives product in the world.
Several market participants complained that market liquidity in S&P 500 overnight trading into the morning of August 5th was dismal, with unquoted strikes, wide quotes (if any) and small bid and offer quantities. We certainly agree with that observation. While it is important to note that the bulk of the dislocations occurred in pre-market trading (i.e. prior to the 9:30am New York open), generally even in pre-market trading liquidity tends to be ample. With a relatively concentrated community of market makers, one might argue that is there is the potential for a reflexive feedback loop whereby as one steps back and quotes wider spreads that pushes the VIX higher, which raises concerns, which push others to wider spreads further, and pushes the VIX higher and so on. That could create the potential for a vicious circle to occur, which could further diminish liquidity.
In a nutshell, the VIX spot calculation caused a degree of confusion, but an even more interesting aspect is how market participants reacted to the events that morning.
Context is important: what bothered markets that morning
It is important to view the pre-market trading from the perspective of what was happening at the time in global markets. After a difficult end to the prior week, Asian markets had kicked off Monday with sharp drops as the unwind of the Japanese Yen carry trade accelerated. All assets which were assumed to be correlated positions with macro carry trade investments sold off, with the Nikkei and the technology-heavy Korean and Taiwan indices collapsing. In Asian hours, while the S&P 500 and Euro Stoxx 50 futures contracts had losses in excess of -3%, the Nikkei 225 was down almost -15% and closed over -13% lower, and Taiwan’s Taiex index futures were effectively halted, trading ‘limit down’ at -10%. Against this backdrop, one can imagine some market participants holding short volatility positions in out-of-the-money puts not wanting to wait until the US market open before unwinding their exposures and we did see some starting to unwind. It was these limited unwinds that set the process in motion that eventually saw the spot VIX pop to 65.
Implied volatility rose and market makers sharply widened bid/ask spreads, and this significantly raised the prospective cost of unwinding. As the VIX rose to higher levels we saw relatively limited trading volumes and spreads widen further. From what we observed in trading volumes It seems many of those holding short volatility positions just held on through the pre-market trading and hoped for a benign outcome. Ultimately, they were right (or lucky?) as such a benign outcome did occur in that the S&P 500 futures held relatively well compared to the onslaught in Asia (outperforming what an analysis of their recent statistical relationship would have suggested), which helped those short volatility stay within their risk limits and thus able to hold on to their positions.
VIX futures saw higher volumes and pricing better reflected the S&P 500 behaviour, with a rise that fell substantially short of that seen in the VIX and was more commensurate with the S&P 500 losses, which at the lowest point in the S&P futures pointed to a loss of just above -4%. What does that tell us? Imagine if the S&P 500 had seen similar price action to the Nikkei and been down double digits in that pre-market trading – would it have been feasible for those short volatility to remain in their positions? We believe a bigger move in the S&P 500 would likely have prompted much greater flow to exit short volatility positions in pre-market trading and at the 9:30am New York open. In the face of limited market maker appetite to take on positions, that would have likely justified a VIX of 65 or even higher. That kind of move typically comes with significant opportunities for our relative value strategy, as we saw in 2020, 2018, 2015 and on other occasions.
Just to highlight one such instance, one may remember the 2015 version of Black Monday when a depreciation of the Chinese Yuan caused strong declines across Asia on Monday August 24th which cascaded through world markets and had the S&P 500 futures down some -7% in pre-market trading when it reached the US. Then as now, the VIX index exploded (at the time, the exchanges even had trouble opening) reaching a level of 53 after the market open. While part of this rise was driven by the same impact of wider quotes in deep out-of-the money options, sustained demand for large quantities of downside options continued after the close, pointing to more meaningful position unwinding. What we recall trading that day (which was one of our most profitable days since inception) was that while there was market anxiety and prices jumped around, volatility remained well tradable.
The relatively modest decline of the S&P 500 on Monday August 5th is a crucial factor as to why volatility was quickly contained and the VIX level retreated so fast. As such, the situation never nearly got as dire as in Japan. While option liquidity returned shortly after the open as markets recovered and the VIX dropped from its highs, we wonder if that would have been the case in the case of larger and persistent declines that would likely have resulted in many more short volatility positions hitting stops. The market fragilities that we have pointed out in our recent articles may well have come into full view.
How liquidity in the VIX inputs has evolved
Observing a decrease in market liquidity in the S&P 500 as well as in other key global indices strongly contrasts with the record trading volumes of the recent past. We think three factors have played a role in what transpired on August 5th.
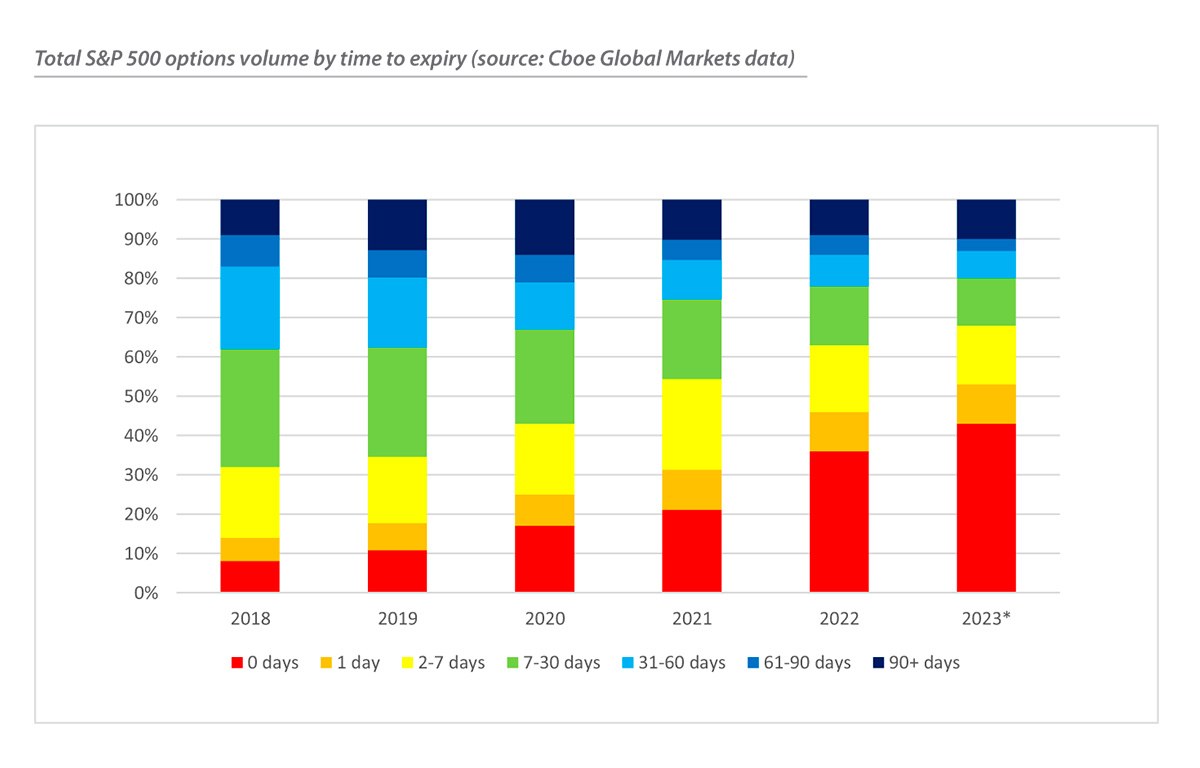
Emphasis on daily options. Rarely has an unappealing abbreviation gained so much traction in financial markets as the term 0DTE. But the explosion of trading in options with ultra-short maturities has been a remarkable phenomenon, attracting droves of traders into derivatives markets. By mid-2023, for the S&P 500 the trading volume of options with zero or one day until expiry exceeded 50% of overall volume1 and the dominance has only increased since. While overall traded volumes have grown, the compression in market share for those options which comprise the VIX calculation is notable. Since 2018, the share of options with maturities between 7 and 30 days declined from 30% to 12% whereas that of options with maturities between 31 and 60 days fell from 21% to 7%, as visible in the below graph.
The shift in attention to shorter dated options may have made the markets for those options which define the VIX calculation more susceptible to shocks. The unwinds of short positions in downside volatility were of a distinctly smaller magnitude than what we observed in earlier episodes (both in August 2015 and particularly in the February 2018 ‘volmageddon’ event or during March 2020) but it appeared market pricing had less depth this time around, resulting in larger price movement.
Dealer positioning matters. The gist of our Volatility Snap Update of July 30th was that the prevalence of volatility selling strategies which applied ultra-short options could have the effect of rapidly and meaningfully shifting dealer positioning. In summary, the drumbeat of daily selling in 0DTE options (among others by banks’ Quantitative Investment Strategies) had the effect of continually replenishing dealer long volatility positions. Consistent (gamma) hedging of the resulting long volatility positions has been a crucial factor in the 400-day absence of downside movement of over -2% in the S&P 500. Absent these flows, the market would be able to roam more freely. This appeared indeed to be the case in the aftermath of the -2.3% decline in the S&P 500 on July 24th. Going into August 5th, the dealers were in a far less comfortable position and according to various research pieces (as well as our observation of the US volatility surface), positioning would markedly deteriorate further on additional downside movement, cutting into the spare powder dealers would have to provide liquidity.
Concentration in the market maker space. Over the past decades, as low latency has become crucial for the ability to profitably engage in liquidity provision, options market making has become a highly capital-intensive business. With that, concentration in the space has grown into the current situation with a relatively small number of leading players. When a dominant liquidity provider would widen its quotes, this would now be noticeable and may trigger follow-on effects from other liquidity providers. As referenced, market participants argued that the screens were sparsely populated at best in the S&P 500 trading. But actually, the impact was even more profound in the Nikkei 225.
A bullet dodged, a lesson learned
In our view, things could have turned out quite differently had the movement in the US markets more resembled that of Asian markets. Market fragility poses a risk of a volatility event morphing into a full blown 1987-like crash. In more than a faint echo to the 1980’s strategy of ‘portfolio insurance, this ties to one aspect that has been widely covered in the post-mortems on August 5th, which is that the VIX and various measures of implied and realized volatility remain important inputs for many quantitative strategies. So-called volatility-controlled funds (which scale their equity exposure inversely to observed market volatility) were among the sellers that morning and all the leveraged (and inverse) ETFs would have had to join the foray should sizeable market losses have held into the close. If the S&P 500 had followed the Nikkei and had a 10%+ down day, this would have had a major impact on measures of volatility and likely resulted in sharp drops in target position sizes for many systematic funds (e.g. volatility-controlled funds, multi-asset funds, CTAs, quantitative macro strategies) and potential signal reversals, that could have triggered much greater selling.
In our view, there are lessons to be learned from what we perceive to be more of a near-miss than an all-clear rallying cry. Those who cut their positions early (which would actually be diligent in the face of a 10% loss in the Nikkei) ended up getting hurt the most. But ignoring the Asian price action was taking a risk. For some that may have been calculated and deliberate, for others perhaps just luck or even not being able to trade at that time. Those in short-volatility positions expecting (or hoping for) a benign outcome may not be as fortunate next time.
Among those who were hurt by cutting were likely some of those employing a dispersion strategy in which index volatility is sold in order to finance a basket of long volatility in the underlying index component. Such a strategy, which essentially shorts correlation, can be quite vulnerable to highly correlated market shocks. But as short volatility investors have learned the hard way before, the risks tend to be underestimated as it is difficult to get out when one really wants to during an extreme event. And if anything, if liquidity remains impaired one could expect options to have even higher convexity in the face of the volatility event. That is currently far from priced in now that implied volatilities have reverted back from their peaks and now trade towards their mid-July lows.
For tail-risk and protective mandates, there are also some takeaways for structuring hedges, albeit more reminders of old truths than new lessons. Liquidity has always been an important aspect of tail hedging as it is crucial to enable monetization. Liquidity in listed equity options is generally notably higher than that of over-the-counter equity options, and of a different order of magnitude to liquidity in often thinly traded exotic options, which can sometimes be dependent on a single counterparty for pricing. When pricing in listed options gets challenging, pricing in OTC and particularly exotic options is much more so and some instruments may simply not be quoted at all. Potential monetization of hedges has always been a crucial component, and in a market environment where liquidity may be impaired, the importance thereof only increases.
Two other aspects could be helpful to consider, particularly for monetizing stress events with short-lived peaks. At first, when hedges are constructed using relatively shorter-dated options, monetization can take place by trading the liquid underlying futures contracts, essentially partially or fully ‘locking in’ substantial market declines when they occur. An added benefit is that this manner of monetization would create potential upside in the event of a rapid market recovery, such as occurred in the immediate aftermath of the market troughs in March 2020.
A second aspect feeds into the typical characteristics of equity index options used in tail hedges. In a strong market decline and associated volatility event, options with exercise prices at or just below the new (and lower!) at-the-money level would tend to ‘explode’ as these are the option contracts market participants flock to unwind short positions or obtain protection. A defensive mandate which applies liquid instruments that provide convexity in such market event may well be positioned in these types of options in demand. Thus, when working with an active manager, a market dislocation could provide a favorable monetization event (even if the peak of the dislocation may be very short-lived). And market experience and global coverage matters as well. When markets throw a curveball, this can catch investors off guard, particularly if it happens outside of standard US market hours – not every firm will have experienced traders across multiple regions. We have been trading derivatives well over two decades, and with stress events being relatively infrequent, it takes a lot of experience to have traded through a range of these events.
To conclude, since the short-lived VIX spike we have seen markets turn more bullish again, in part helped by economic data that has raised the prospects of Fed easing, but also renewed risk appetite, which seems in some part influenced by the VIX episode. We think the lessons from August 5th are less benign. Markets appear to be fully convinced of a benign soft landing, but history reminds us that cycles often end in a much less benign way. With implied volatilities having been marked down dramatically back to mid-July levels, and even the volatility of volatility almost back to mid-July levels, the markets appear to be treating the VIX event as if it never happened. We think that is to miss some lessons. With hedge pricing again unusually low, we believe this could be an attractive entry point into tail hedges and strategies that can benefit from higher volatility.
–––––––––––––––––––––––––––––––
The publication of this article is available as a PDF. Download it following the link below:
One VIX spike does not make a summer>>
–––––––––––––––––––––––––––––––
1. Source: CBOE; “The evolution of Same Day Options Trading”; 3 August 2023.
* 2023 figures were year-to-date figures as per dissemination of the sourced article
- Bloomberg Publication: True Partner Volatility Hedge Fund Gains 5.9% During April Rout
- True Partner to join the London Volatility Investing Event 2025
- Wat zijn de gevolgen voor pensioenfondsen van een zware beursdaling?
- What would a significant market downturn mean for Dutch pension funds?
- True Partner article: Does America First signal the end of American exceptionalism?
- True Partner’s co-CIO speaking at the Global Volatility Summit Tokyo
- True Partner Capital speaks in Northern Trust panel about Navigating the Shift to WTP
- Happy New Year
- True Partner article: 2025 Market Outlook
- One VIX spike does not make a summer
- More news articles >
- Go to events >