Page 4: Volatility update January 2020
Volatility is back in the bottom quartile again
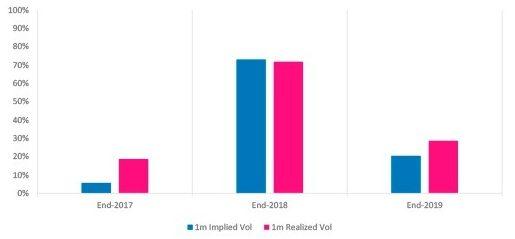
So, what will the next 12 months bring? Our trading is driven by our proprietary relative value views, rather than a macro view on volatility, but we know from experience that it is easier for the market to be surprised when the world expects calm. At the end of 2018, on average 1-month implied and realized volatility were around the 70th percentile across our traded markets. As of the end of 2019, implied volatility is back to the bottom quartile, while realized is just into the third quartile, suggesting more room for spikes that could create dislocations.
Year-End Implied and Realized Volatility Percentile 12

Market consensus suggests low conviction in equity longs, while credit has potential gap risk
Expectations for market returns and the stage of the cycle can also influence investor reactions to events. It is a common refrain that equity valuations are very high – and indeed Robert Shiller’s famous cyclically adjusted P/E ratio is now at 31x in the US, above its 2007 peak (27x). There are other signs of excess too, such as the proportion of loss-making IPOs returning to around its tech bubble high.13 We share the common concerns but are more interested in how perceptions of value will affect investor behavior.
Over the last couple of months various brilliant minds have been providing their forecasts for 2020. What history tells us is that however talented individual strategists are, as a group they tend to be optimistic. As the New York Times recently pointed out, citing research from Bespoke Investment Group, the median strategist forecast for the S&P 500 has been positive every year for the last 20 years (remember that stocks have fallen for 6 of those 20 years)14, and their median forecast has, on average, been almost twice as high as the actual index return (average median forecast of +9.8% vs. an actual average gain of +5.5%.15
In that light, we find it particularly interesting that entering 2020 the median strategist forecast for the S&P 500 was only 3,241 – only +0.3% above the closing level of 2019. Furthermore, as the Wall Street Journal recently noted, much of the projected +9.6% growth in earnings is expected to come from rising profit margins – despite very low unemployment and rising labor costs. 16
Credit markets also have some interesting dynamics. As the New York Fed’s Liberty Street Economics blog pointed out this month, corporate bond issuance is increasingly at the lower end of investment grade and the net leverage of non-AAA investment grade firms now exceeds that of high yield firms. Meanwhile research notes that institutional investors such as insurance companies often divest from bonds that fall below investment grade and that large or distressed transactions often incur higher costs. That may also make credit vulnerable to a shift higher in economic risks – or simply to disappointment in profit margins.17
Political and economic risks remain
The US election on November 3rd is clearly the big political event of the year, and we will be watching for short-term opportunities as investors position around the various events leading up to this over the coming months. This election could have unusually large implications for corporate earnings, as tax policy is a major area of divide.
The frontrunners for the Democratic nomination have all proposed at least a partial repeal of the 2017 Tax Cut and Jobs Act (TCJA), so if the Democrats take control of the Senate, corporate tax rates seem likely to rise. Whether that would be good or bad for the US, it should have implications for equities. Recall that the TCJA cut the federal statutory corporate income tax rate from 35% to 21%. At the moment, markets seem to be assuming a base case that the Democrats will not win control of the Senate and the Presidency. That may be the modal outcome according the polls – but it is far from a foregone conclusion. Prediction markets currently imply a 30% probability of a Democrat majority in the Senate,18 suggesting markets should price a reasonable chance of higher taxes.
Markets have rallied on positive trade news, but risks remain. There has been optimism around the phase one US/China deal but there is much work left to do to progress from there. Japan and Korea are engaged in an ongoing and politically influenced trade dispute. Brexit may also prove on an ongoing concern for the FTSE 100 and European equity markets, with UK Prime Minister Boris Johnson having set a hard deadline for a trade deal that has been publicly undermined by European Commission President Ursula von der Leyen. 19
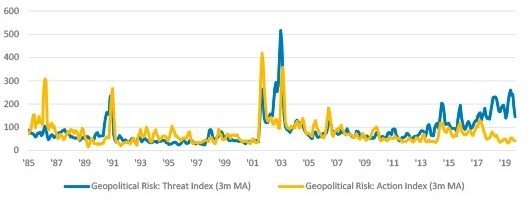
The US/Iran skirmish has also reminded the world of the bigger potential geopolitical threats. Interpreting the various uncertainty indices is difficult as uncertainty does not have a linear translation into higher risk. However, we find it intriguing that the biggest gap ever between “threat” and “action” came just before January’s US/Iran skirmish.
Geopolitical Risk – Jan 1985 to Nov 2019 20

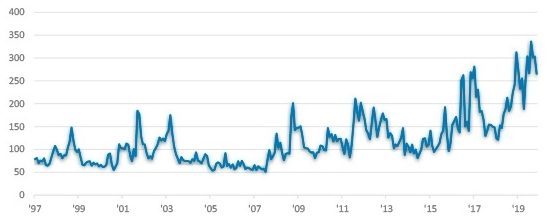
Economic policy uncertainty also remains elevated, and central banks have even less room for maneuver in 2020, after substantial easing in 2019. Meanwhile, there is increasing pressure on governments to increase fiscal spending and benefit workers at the expense of corporate profits, which could pressure inflation rates and therefore bonds.
Global Economic Policy Uncertainty Index – GDP Weighted (Jan 1997 to Nov 2019) 21

-
Continue reading to the next page of this article >>
–––––––––––––––––––––––––––––––
The full publication of this article is available as a PDF. Download it following the link below:
January 2020 Volatility Update - Global cooling>>
–––––––––––––––––––––––––––––––
1. nytimes.com
2. Sources: Bloomberg, True Partner, Eurekahedge. True Partner Fund returns are Class B, USD, net of 2/20 fees.
3. cnbc.com
4. Sources: Federal Reserve, True Partner federalreserve.gov, federalreserve.gov
5. Sources: Bloomberg, True Partner. Kospi 200 value is the simple average of the last two trading days of December and the first trading day of January as liquidity is more limited beyond 6-month maturities.
6 -12. Sources: Bloomberg, True Partner
13. wsj.com
14. For those intrigued, the consensus forecast for 2008 S&P 500 returns was for an +11.1% gain – this miss accounts for a significant part of the on average over-optimistic bias.
15. nytimes.com
16. wsj.com
17. libertystreeteconomics.newyorkfed.org; on liquidity see libertystreeteconomics.newyorkfed.org and bankunderground.co.uk
18. US PredictIt 2020 Senate Party Control Democratic, as of January 10, 2020
19. bbc.com
20. Data from policyuncertainty.com based on the paper: Caldara, Dario and Matteo Iacoviello, “Measuring Geopolitical Risk,” working paper, Board of Governors of the Federal Reserve Board, 2017”.
21. Source: policyuncertainty.com
22. Source: Bloomberg Negative Yielding Debt Index Market Value, as of January 10, 2020
23. Source: Bloomberg, as of January 10, 2020
24. Source: Bloomberg Negative Yielding Debt Total Return Index
–––––––––––––––––––––––––––––––
- Bloomberg article highlights True Partner’s strong performance in April and year-to-date
- Bloomberg Publication: True Partner Volatility Hedge Fund Gains 5.9% During April Rout
- True Partner to join the London Volatility Investing Event 2025
- Wat zijn de gevolgen voor pensioenfondsen van een zware beursdaling?
- What would a significant market downturn mean for Dutch pension funds?
- True Partner article: Does America First signal the end of American exceptionalism?
- True Partner’s co-CIO speaking at the Global Volatility Summit Tokyo
- True Partner Capital speaks in Northern Trust panel about Navigating the Shift to WTP
- Happy New Year
- True Partner article: 2025 Market Outlook
- More news articles >
- Go to events >