Page 2: Volatility update January 2020
Surprise policy stimulus helped markets rise and volatility fall
Looking at 2019 as a whole, equity markets were buoyed by a positive monetary policy surprise, the associated easing of broader financial conditions, and positive developments in trade policy (with a couple of wobbles), as fears of an escalating US/China trade war receded and a phase one deal was reached – though we would point out there is still a lot left to do to resolve the trade disagreements.
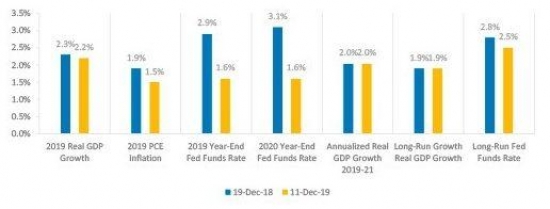
In Q4 2018 fears of slowing growth and higher rates helped drive a sharp sell-off in risk assets, following which the Fed turned dovish. Entering 2019, the Fed’s “dot plot” projection was still suggesting multiple rate hikes during the year, to take rates from 2.375% to 2.875%. At the December 2018 Fed meeting (remember it hiked rates but lowered its projections at the meeting), not a single member submitted projections expecting cuts in 2019. Given what happened to rates in 2019 it’s interesting to recall that President Trump – not always the market’s favorite economist – tweeted before the meeting that he thought it was “incredible that the Fed is even considering yet another interest rate hike”.3
Rather than the projected two further hikes in 2019, the Fed instead turned very dovish, cutting rates three times to 1.625% and starting to expand its balance sheet again to ease liquidity strains in funding markets. Multiple other central banks around the world also eased policy, including the ECB resuming QE. Helped by this stimulus, 2019 US real GDP growth is expected to come in only 0.1% below the Fed’s December 2018 projection, with annualized growth over 2019-21 the same as projected a year ago. Given where rates now are, this kind of large positive policy surprise will be very difficult to repeat in 2020.
Median Projections for Year-End Value from Fed “Dot Plot”, Dec 2019 vs. Dec 20184

Realized volatility came in well below market implied volatility entering the year
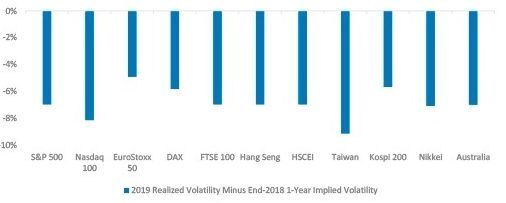
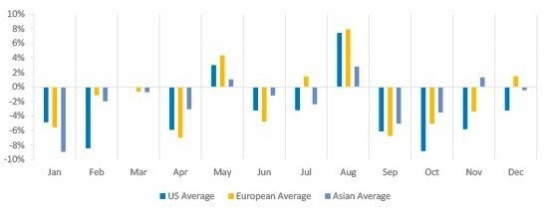
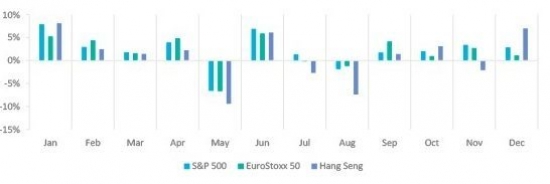
Volatility markets were also surprised by the about turn from the Fed. Entering 2019, 1-year implied volatilities ranged from 15% (Australia) to 25% (Nikkei) across our traded markets. 1-month implied volatilities – where we tend to focus much of our trading – were generally similar, but a little higher. In the end, realized volatilities came in on average 7 percentage points below the 1-year implied levels, or 35% below in relative terms, with relatively little differentiation by market. On a rolling basis, monthly realized volatility also came in below implied in most markets, in most months. Even in the two sell-off months of May and August, the reaction was somewhat subdued, particularly in Asia.
2019 Realized Volatility vs. 1y Implied Volatility as of End 2018 5

Monthly Realized vs. Start of Month Implied Volatility by Region in 2019 6

Monthly Market Returns in 2019 – Major US, European and Asian Indices 7

-
Continue reading to the next page of this article >>
–––––––––––––––––––––––––––––––
The full publication of this article is available as a PDF. Download it following the link below:
January 2020 Volatility Update - Global cooling>>
–––––––––––––––––––––––––––––––
1. nytimes.com
2. Sources: Bloomberg, True Partner, Eurekahedge. True Partner Fund returns are Class B, USD, net of 2/20 fees.
3. cnbc.com
4. Sources: Federal Reserve, True Partner federalreserve.gov, federalreserve.gov
5. Sources: Bloomberg, True Partner. Kospi 200 value is the simple average of the last two trading days of December and the first trading day of January as liquidity is more limited beyond 6-month maturities.
6 -12. Sources: Bloomberg, True Partner
13. wsj.com
14. For those intrigued, the consensus forecast for 2008 S&P 500 returns was for an +11.1% gain – this miss accounts for a significant part of the on average over-optimistic bias.
15. nytimes.com
16. wsj.com
17. libertystreeteconomics.newyorkfed.org; on liquidity see libertystreeteconomics.newyorkfed.org and bankunderground.co.uk
18. US PredictIt 2020 Senate Party Control Democratic, as of January 10, 2020
19. bbc.com
20. Data from policyuncertainty.com based on the paper: Caldara, Dario and Matteo Iacoviello, “Measuring Geopolitical Risk,” working paper, Board of Governors of the Federal Reserve Board, 2017”.
21. Source: policyuncertainty.com
22. Source: Bloomberg Negative Yielding Debt Index Market Value, as of January 10, 2020
23. Source: Bloomberg, as of January 10, 2020
24. Source: Bloomberg Negative Yielding Debt Total Return Index
–––––––––––––––––––––––––––––––
- AI Top or Slop: When Markets Reach Peak Magnificence
- The Hedge Fund Journal features True Partner's award-winning volatility strategies
- True Partner Fund wins award for strong performance
- True Partner releases new thought piece focused on Dutch pension funds
- True Partner Fund nominated for best performing relative value fund
- Bloomberg article highlights True Partner’s strong performance in April and year-to-date
- Bloomberg Publication: True Partner Volatility Hedge Fund Gains 5.9% During April Rout
- True Partner to join the London Volatility Investing Event 2025
- Wat zijn de gevolgen voor pensioenfondsen van een zware beursdaling?
- What would a significant market downturn mean for Dutch pension funds?
- More news articles >
- Go to events >