Page 1: Volatility update January 2020

2019 saw rising temperatures and risk assets, but a cooling in volatility
From a weather perspective, the year 2019 was characterized by many extremes: global ocean temperatures reached record highs1, and across the world weather patterns have become more volatile. For risk assets, it was also a year of records, with new highs in stock markets and all-time lows in bond yields. While we have unfortunately seen severe weather events strike several times during the year, markets have experienced relative calm. That has meant for volatility it has been a year of severe cooling, with sharp declines in most measures of equity volatility. Unfortunately, this created a challenging environment for True Partner and many volatility funds.
After declines in 2018, global equity markets had one of their strongest ever years in 2019, with the MSCI World Total Return (Hedged USD) up +28.4% and the S&P 500 Total Return (Net) up +30.7%. Both indices delivered higher returns than in the recovery years of 2003 and 2009, helping long biased investors in a range of strategies. Meanwhile, the risks that had caused worries entering the year were largely set aside. The VIX Index of US equity volatility fell from 25 to 14, the V2X index of European equity volatility fell from 24 to 14 and in Japan the Nikkei Stock Average Volatility Index fell from 29 to 15 – below its level at the end of 2017 and its lowest year-end level since 2006.
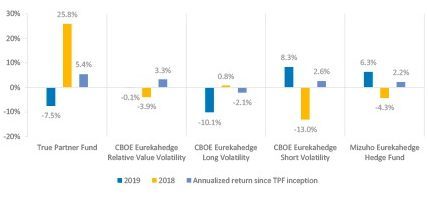
After being up +25.8% in 2018, the True Partner Fund was down -7.5% in 2019, a disappointing performance. After outperforming the CBOE Eurekahedge Relative Value Volatility Index by almost +30% in 2018, the Fund underperformed the index in 2019, but True Partner again outperformed the CBOE Eurekahedge Long Volatility Index. As many know, while our strategy is relative value, our correlation and beta profile have historically been closer to the Long Volatility Index. Since inception in 2011, the True Partner Fund has had a -0.4 correlation and a -0.4 beta to MSCI World; over the same period the RV Volatility Index has had a +0.6 correlation and +0.2 beta to MSCI World, while the Long Volatility Index has had a -0.7 correlation and a -0.3 beta to MSCI World.
While frustrated by our 2019 return and focused on what we can do better, we know that it is only a one standard deviation event given our 11% annualized volatility, so we should be cautious about over-learning lessons from one tough year. We are happy to say that since inception the True Partner Fund has still comfortably outperformed the Relative Value, Long and Short Volatility Hedge Fund indices, and the broader hedge fund index.
True Partner Fund vs. Hedge Fund Indices2

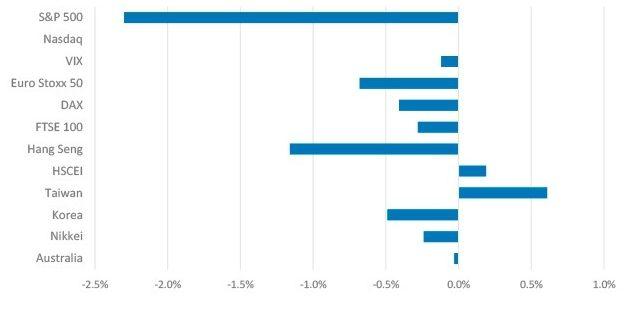
In 2019 the Fund experienced small losses in most markets, with gains in Taiwan and the HSCEI and the largest losses incurred on S&P 500 options. The directionality of positions varied by market over the course of the year, but the S&P 500 losses were mostly incurred on long volatility positions.
True Partner Fund: 2019 Gross Attribution by Market

-
Continue reading to the next page of this article >>
–––––––––––––––––––––––––––––––
The full publication of this article is available as a PDF. Download it following the link below:
January 2020 Volatility Update - Global cooling>>
–––––––––––––––––––––––––––––––
1. nytimes.com
2. Sources: Bloomberg, True Partner, Eurekahedge. True Partner Fund returns are Class B, USD, net of 2/20 fees.
3. cnbc.com
4. Sources: Federal Reserve, True Partner federalreserve.gov, federalreserve.gov
5. Sources: Bloomberg, True Partner. Kospi 200 value is the simple average of the last two trading days of December and the first trading day of January as liquidity is more limited beyond 6-month maturities.
6 -12. Sources: Bloomberg, True Partner
13. wsj.com
14. For those intrigued, the consensus forecast for 2008 S&P 500 returns was for an +11.1% gain – this miss accounts for a significant part of the on average over-optimistic bias.
15. nytimes.com
16. wsj.com
17. libertystreeteconomics.newyorkfed.org; on liquidity see libertystreeteconomics.newyorkfed.org and bankunderground.co.uk
18. US PredictIt 2020 Senate Party Control Democratic, as of January 10, 2020
19. bbc.com
20. Data from policyuncertainty.com based on the paper: Caldara, Dario and Matteo Iacoviello, “Measuring Geopolitical Risk,” working paper, Board of Governors of the Federal Reserve Board, 2017”.
21. Source: policyuncertainty.com
22. Source: Bloomberg Negative Yielding Debt Index Market Value, as of January 10, 2020
23. Source: Bloomberg, as of January 10, 2020
24. Source: Bloomberg Negative Yielding Debt Total Return Index
–––––––––––––––––––––––––––––––
- AI Top or Slop: When Markets Reach Peak Magnificence
- The Hedge Fund Journal features True Partner's award-winning volatility strategies
- True Partner Fund wins award for strong performance
- True Partner releases new thought piece focused on Dutch pension funds
- True Partner Fund nominated for best performing relative value fund
- Bloomberg article highlights True Partner’s strong performance in April and year-to-date
- Bloomberg Publication: True Partner Volatility Hedge Fund Gains 5.9% During April Rout
- True Partner to join the London Volatility Investing Event 2025
- Wat zijn de gevolgen voor pensioenfondsen van een zware beursdaling?
- What would a significant market downturn mean for Dutch pension funds?
- More news articles >
- Go to events >